The California Power System in 2025: How Battery Storage Is Rewriting the Daily Operation of the Electricity Market (I)
Introduction – A Window into the Future
From our European perspective, taking a close look at the day-to-day reality of California’s power system is like observing an open-air laboratory from which to learn, and from which we can anticipate what our own daily life might look like a few years from now. The reason is that, until about five years ago, California’s electricity system had a daily reality very similar to the one we currently have in Spain: a lot of photovoltaic generation and large energy surpluses at midday.
However, in 2020 California began to change this daily reality with the introduction of the first grid-scale batteries into its power system. As a result, today, in terms of storage, California is four or five years ahead of us, and of many other European power systems, in what concerns energy storage capacity integrated into the daily electricity mix.
This has become particularly evident with the recent publication by the California market operator (CAISO, DMM) of the 2024 data in a document entitled Special Report on Battery Storage. This report offers a very accurate snapshot of the current operation of California’s power system and can serve as a highly valuable benchmark for making projections about what our immediate future may look like once our own system reaches the levels of energy storage that California already has today.
This is especially relevant if we bear in mind that 2025 has been the first year in which, in Spain, batteries have begun to be discussed seriously as critical system infrastructure, and not just as an occasional auxiliary resource, as had been the case until now. In California, that step was taken some time ago, and today the rollout of batteries is consolidated and continues to advance at a pace that, for the moment, we can only imagine here. The data published this year by the Californian regulator clearly show a pattern in the evolution of electricity prices across the different hours of the day that is very different from our own, and that is a clear reference point for where we are headed if, in the coming years, we generalize storage as an integral part of our system’s electricity mix.
California 2020–2024: The Jump from 0.5 to 13 GW
In just four years, the battery fleet operating in the CAISO market has grown from around 500 MW in 2020 to nearly 13.000 MW in December 2024, with a total energy storage capacity by the end of last year of around 47.300 MWh. In the current reality of California’s electricity demand, this level of capacity means that, if all these batteries were fully charged and asked to discharge at full power to the grid, they could supply energy to the system for about 3,6 hours. This value is very close to the four hours that, in practice, is the average daily period during which the batteries are currently supplying energy to cover the critical demand window between 18:00 and 22:00.
Operationally, the effect of these batteries on California’s power system is clear: at midday, the batteries absorb a large share of the solar surplus and reduce both “cheap” exports and the need for curtailment, that is, the need to shut down renewable production because the system cannot absorb it. In the evening, by contrast, the energy accumulated during the sunny hours is returned to the grid, reducing the need to start up gas-fired plants. This has led, on the one hand, to a smoothing of the well-known duck curve over the course of the day, prices do not fall as sharply during sunny hours, and, on the other hand, to a softening of the ramp-up in electricity prices between 18:00 and 22:00, as the energy stored in the batteries enters the mix and partially reduces dependence on natural gas in the hours when demand from consumption begins to rise.
On 1 January 2025, batteries in California’s power system accounted for approximately 14% of the available capacity in the CAISO system. At first glance, this may seem like a modest figure, but it is not. With “only” this share within the system, batteries have already managed to play a fundamental role in day-to-day operation. On winter and summer afternoons and evenings, batteries become a key component of the electricity mix and cease to play a merely “backup” role. And the forecast is that, in the coming years, this 14% share of available capacity currently represented by batteries will be significantly exceeded. At present, around 46% of the capacity of all new projects awaiting connection to CAISO include batteries, either as stand-alone installations or as hybrid projects with renewables. This points to a clear trend: in less than two years, storage in California could double. And if that happens, with more capacity to absorb excess midday solar and return it in the evening, the price curve between the hours of maximum photovoltaic production and those of maximum demand will flatten even further.
Even with today’s figures for photovoltaic production, and despite the storage capacity already in place, the data show that California’s power system still has substantial room to incorporate additional batteries that would make it possible to exploit a much larger share of the solar generation available on any given sunny day.
The Day-to-Day Operation of California’s Power Grid
With this volume of storage capacity integrated into the power system, the operational pattern on a “normal” day in California can be broken down into a sequence of hourly blocks like the following:
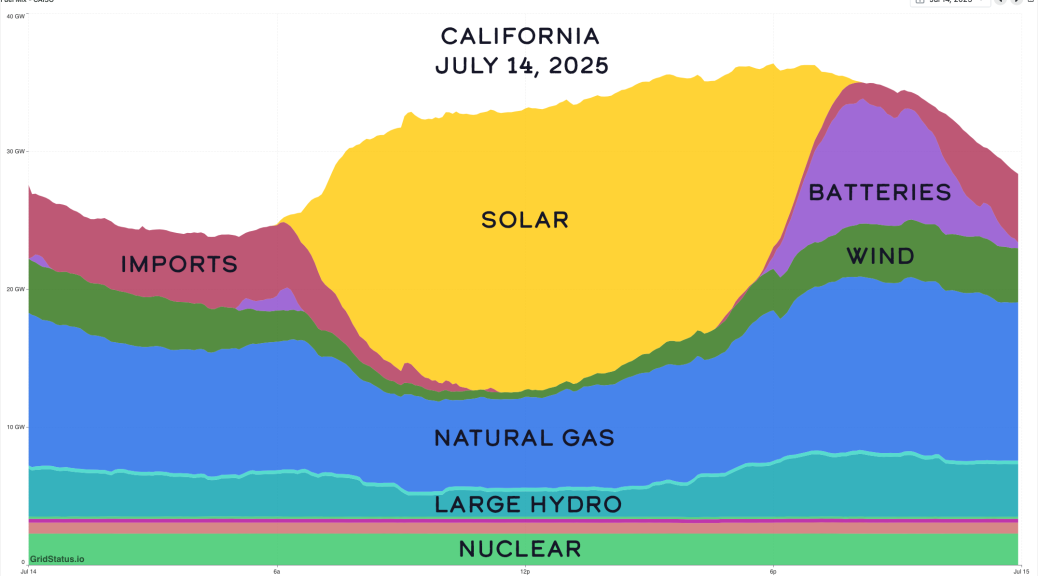
- In the early hours of the morning, roughly between midnight and 6 a.m., there is no solar production, and the system is sustained mainly by natural gas, nuclear power, wind energy, hydropower, and imports from neighboring systems. The batteries connected to the grid are practically empty and only make a small contribution between 5 a.m. and 6 a.m., delivering the remaining energy they contain to the system just before that day’s solar production begins.
- In the morning, from 06:00 to 10:00, solar generation begins to ramp up, which makes it possible to cut back gas use and reduce imports. It is also during this period that batteries start to charge, taking advantage of the progressive increase in photovoltaic output.
- At midday, between 11:00 and 17:00, solar generation usually dominates the mix with values that often hover around 20 GW and can occasionally exceed 21 GW on sunny days. Gas remains at technical minimums, and the batteries absorb several gigawatts for three to four hours. At many moments, photovoltaic production exceeds internal demand, and the system is able to export energy to other states. This situation tends to drive market prices down significantly, but the growth of the storage fleet helps reduce both the volume of low-priced exports and the extent of curtailment.
In this respect, it is worth highlighting data from another document published by CAISO, entitled Key Statistics – June 2025, which indicates that on 12 June the CAISO system reached a record level of net exports of up to 7,38 GW to neighboring systems during the peak solar production window.
Complementing this, another CAISO publication, the Monthly Renewables Performance Report – June 2025, indicates that the maximum solar generation in June 2025 was 21,6 GW around midday, a level the system reached on the 13th according to the operator’s own statistics.
These figures illustrate just how dominant solar PV has become during the central hours of the day and how, when internal demand is saturated, the system is forced to export large amounts of energy despite the current storage capacity available in the Californian grid.
- In the late afternoon and evening, between 18:00 and 22:00, photovoltaic production falls sharply, and gas and imports gain weight. Net demand, that is, total demand minus renewable production, increases, and with it the upward pressure on electricity prices. It is precisely in this window that batteries begin to discharge intensively the energy accumulated at midday, reducing the need for gas-fired plants and thereby softening the rise in the price per kWh. To prevent this discharge from being concentrated only in the first expensive hour and the batteries from being too depleted for the rest of the evening, the system applies constraints on their state of charge in each hour: this is what is known as End-of-Hour State of Charge (EOH-SOC), i.e. a minimum level of charge that the battery must maintain at the end of each hour or of certain key hours. In practice, this forces the discharge to be spread over the entire critical window (for example, from 18:00 to 22:00) and ensures that the batteries continue to supply energy when demand and prices are most stressed, thereby reducing the use of natural gas in those hours. On peak summer days, battery discharge has covered approximately a quarter of evening consumption, with injections of 8–10 GW in the critical hours. One example of this was 19 June 2025, between 19:00 and 21:00, when batteries were the main source of electricity in the CAISO system, providing energy equivalent to roughly 26% of total consumption.
- At night, from 22:00 onwards, the contribution of battery energy ends until the following day. At this time of day, wind generation usually gains weight, hydro provides a stable cushion, and gas and nuclear cover the remaining difference to guarantee supply.
With this hourly operating scheme, the 2024 data show that the current reality of the Californian power system is that at midday, between 10:00 and 13:00, when solar production is abundant and electricity is cheap, battery charging accounts on average for 14,7% of total system demand. In contrast, in the evening, between 17:00 and 21:00, when consumption rises and prices tend to climb, these same batteries discharge and supply on average 8,6% of the electricity consumed in that time window. Within this discharge period, the usual peak occurs at around 19:00, with an average injection of 5.700 MW in 2024. To put this figure into context, in 2023 this average injection at 19:00 was around 2.700 MW. Thus, in just one year, the contribution of batteries to the system in the 19:00 time slot has more than doubled, which has made it possible to reduce the peak output that gas-fired plants must provide to cover overall demand.
The underlying message is simple but powerful: when photovoltaic generation has a very significant weight in the system, the deployment of batteries becomes a key structural element because it allows the price curve over the day to be flattened and reduces dependence on natural gas in hours with less sunlight.
Conclusion
In short, the daily operation of California’s power system is a real-world example of what happens when, in a system with a large share of solar PV, batteries are introduced as structural elements of the electricity mix in order to store part of the energy produced during the hours of maximum solar generation and use it later in the early evening hours, when demand begins to rise.
In just a few years, California has gone from having around 500 MW of batteries to having a current total capacity of about 13.000 MW. The process of deploying these 13 GW and integrating them into day-to-day operations has changed the way the system meets electricity demand across the different time slots of the day: at midday, batteries absorb solar surpluses that previously would have had to be exported or wasted, and in the evening they are used to supply a significant share of demand precisely when renewable output falls and the system is most vulnerable to price spikes. The hourly pattern we now observe in California, with batteries charging when energy is abundant and cheap and discharging when demand and prices rise, is the clearest demonstration that storage can move from being a sporadic resource to becoming a structural pillar of the system.
That said, it is important to remember that this hourly snapshot is only part of the story. To understand the full extent to which batteries have transformed the Californian system, we also need to look at what happens “on the other side of the meter” and analyze the growing role of self-consumption, virtual power plants, and digital programs that coordinate thousands of home batteries, as well as the combined impact of all this on the price of a kWh. This will be precisely the guiding thread of the second part of this article, where we will examine how the energy coming from residential batteries contributes to California’s power system and how this entire storage ecosystem, both grid-scale and residential, has influenced the evolution of energy costs in California over the last five years.