Energy Transition in Catalonia: Insights into 34 Years of CO₂e Emissions.
The other day, I came across a news article that caught my attention. The University of Potsdam published the results of an intriguing study from an industrial and environmental perspective in the prestigious scientific journal Proceedings of the National Academy of Sciences (PNAS). After analyzing data from 1,500 regions worldwide over the past 30 years, the researchers concluded that 30% of these regions managed to reduce carbon emissions while maintaining sustained economic growth. This phenomenon is technically known as “green growth.” According to the report, these 1,500 regions account for 85% of global emissions, giving the results significant relevance and underscoring the importance of the study.
Another conclusion from the study was the notable regional differences in the evolution of emissions. Europe, for example, has consistently outperformed other parts of the world in decoupling emissions from economic growth, maintaining this trend over the last 20 years. In contrast, North America and Asia have shown more variable results, although improvements have been observed over the last decade.
The study also highlighted the importance of fostering innovation by developing industrial processes based on new technologies and sustained investment in renewable energy in both the public and private sectors. This approach is essential to help regional economies progress towards sustainability without compromising economic growth. At this point, I wondered if Catalonia, in its current socio-economic context, was part of the 30% of regions that managed to reduce emissions while maintaining economic growth. Regardless of the answer, I was curious about what trends could be expected for greenhouse gas emissions in the coming years.
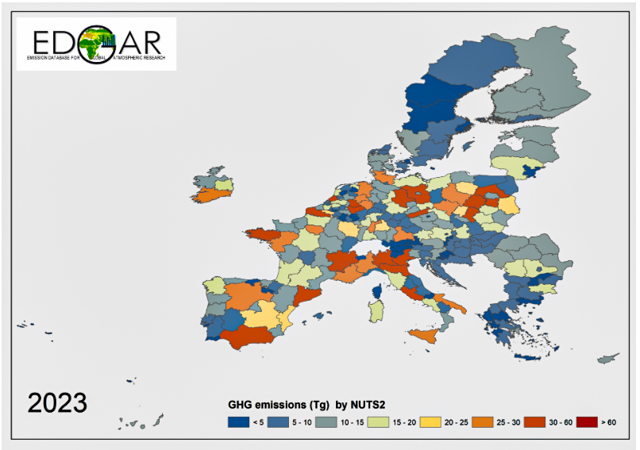
With this in mind, I visited the project’s website mentioned in the University of Potsdam’s report. Exploring the study references, I downloaded the EDGAR1 (Emissions Database for Global Atmospheric Research) dataset. This database collects and provides detailed information on greenhouse gas emissions and other atmospheric pollutants from anthropogenic sources2. It is maintained by the Joint Research Centre (JRC) of the European Commission in collaboration with the PBL Netherlands Environmental Assessment Agency.
https://edgar.jrc.ec.europa.eu/dataset_ghg2024_nuts2
The EDGAR file compiles annual emissions data from all European regions for the 1990–2023 period, including gases like CO₂ (carbon dioxide) from fossil sources, CH₄ (methane), N₂O (nitrous oxide), and fluorinated gases3 (F). To facilitate the comparison of the annual climate impact of each region, regardless of the volume of each gas emitted, all emissions are converted into terms of CO₂ equivalent (CO₂e)4. This unit is calculated by multiplying the volume of each emitted gas by its Global Warming Potential (GWP). This metric expresses how much more a gas contributes to global warming than CO₂ over 100 years. For example, methane has a GWP of 28, meaning one ton of methane has a climate impact 28 times greater than CO₂. Nitrous oxide, with a GWP of 265, is even more damaging, while some fluorinated gases, with GWP values exceeding 1,000, are particularly harmful even in small quantities. This methodology facilitates comparisons between regions by unifying emissions under a single criterion and measuring their global climate impact, regardless of the specific proportions of gases emitted in each area.
From the EDGAR database, I compiled data on Catalonia regarding the emissions of various gases generated by different economic sectors during the period 1990–2023 into a spreadsheet. Using this information, I created a time series of the total annual CO₂ equivalent (CO₂e) emissions, which allowed me to generate the graph presented below:

This graph clearly illustrates the temporal evolution of total CO₂-equivalent emissions in Catalonia over the past 34 years, serving as the starting point for a detailed analysis of future greenhouse gas emissions trends from 2024 onwards. Analyzing the graph, one can easily see the evolution of emissions in Catalonia from 1990 to 2023, marked by several well-defined phases:
- 1990–2007: Progressive Increase. During this period, a general trend of increasing emissions is associated with economic expansion and heightened activity in sectors such as construction and industry.
- 2008–2014: Decline Due to the Economic Crisis. From 2008, coinciding with the onset of the economic crisis triggered by the subprime mortgage collapse, emissions peaked and decreased progressively until 2014. This decline is primarily attributed to the sharp economic contraction, especially in construction, and a general reduction in productive activity.
- 2015–2019: Recovery in Emissions. As the economic crisis eased, emissions began to rise again, reflecting an economic recovery that involved increased energy consumption and industrial activity.
- 2019–2023: Sustained Decline. From 2019 onwards, a trend shift is observed, with a sustained reduction in emissions. This decline may be linked to stricter climate policies, the adoption of cleaner technologies in production processes, and, particularly, the impact of high-energy prices in the years following the COVID-19 pandemic.
According to the data in the chart, a continuous decrease in emissions can be observed in Catalonia during the 2019-2023 period, with a progressive reduction in total emissions. This trend suggests that Catalonia could be part of the 30% of regions identified in the University of Potsdam study that have managed to reduce their environmental impact without compromising economic growth. In particular, the reduction recorded in 2021, 2022, and 2023 compared to 2019 reflects the influence of various factors in the Catalan economy that have driven measures to mitigate emissions. Among these factors are implementing more effective climate policies and the impact of high-energy prices. The latter has incentivized more efficient use of resources, encouraged the integration of sustainable technologies in different economic sectors, and significantly reduced operating hours and annual MWh generated from natural gas in Catalonia’s combined-cycle and cogeneration plants5.
This behavior aligns with and complements other data we have from various sources that help to understand the global scenario of the energy transition in Catalonia. A notable example would be the case of energy intensity, a key industrial indicator that measures the amount of energy needed to generate one euro of product. This figure is particularly relevant because it provides a quantitative view of how the Catalan economy has evolved in its use of energy resources relative to its productive activity. Energy intensity is calculated by dividing the annual GDP of the Catalan industrial sector by its energy consumption. In the case of Catalonia, if we calculate this parameter using annual data from IDESCAT for the period 2003-2022, we find that the energy intensity of the Catalan industry has experienced a significant decrease, from 1.46 kWh/€ in 2003 to 0.78 kWh/€ in 2022. This is consistent with what we have obtained from the analysis of EDGAR data, which shows that, in recent years, Catalonia’s annual CO₂e emissions have been steadily decreasing.
Thus, once it has been established that Catalonia appears to fall within the 30% of regions identified by the University of Potsdam study, we can consider complementing this analysis with a short-term prediction of CO₂e emissions behavior based on the available annual data6.
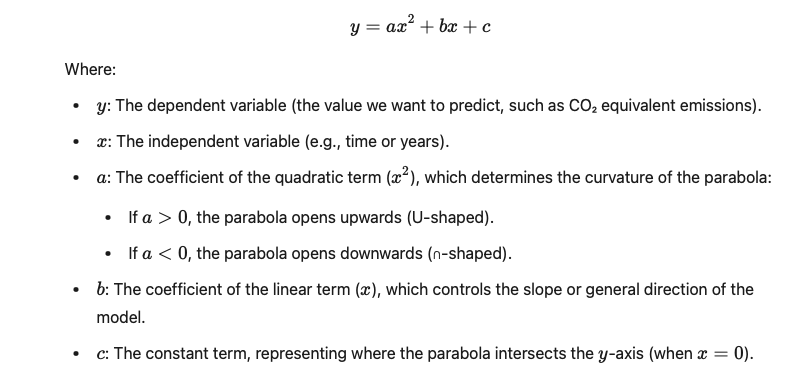
As shown in Graph 1, the data reveal a nonlinear behavior of CO₂e emissions over the past 34 years. In this context, a quadratic regression has been considered an appropriate option as a first approach to model the system and estimate the evolution of emissions in the coming years7. However, it is always essential to bear in mind that quadratic regression, although helpful in analyzing and understanding the historical behavior of the data, is not the most suitable model for precise predictions, as its structure or mathematical nature does not account for the random component of external factors that could significantly impact the results. Nevertheless, it is worth emphasizing, even if it seems repetitive, that quadratic regression has been chosen because it is a simple and effective technique for modeling nonlinear relationships between two variables: an independent variable (X, in this case, the years, serving as a temporal framework) and a dependent variable (Y, the CO₂e emissions). This statistical model allows the identification of general trends and, as long as there are no significant contextual changes, predicts how the trend of emissions in Catalonia might evolve in the short term8.
To forecast CO₂-equivalent emissions in the coming years, the data from EDGAR are organized into three-time intervals to determine whether the trends are consistent between them or to identify significant behavioral differences in the model across periods. The time intervals are:
- 1990–2023: Long-term analysis to understand global trends.
- 2014–2023: Medium-term analysis focusing on the impact of policies after the subprime crisis.
- 2019–2023: Short-term analysis to capture the most recent changes.
For those interested in delving deeper into the calculation procedure and mathematical foundations of the quadratic regression model and the evaluation of statistical model quality, I provide a detailed explanation of these mathematical data analysis methods in this link.
Thus, quadratic regression is applied to the data from each defined period to determine the emissions trend in Catalonia. The objective of this method is to find, from these actual data, the parameters referred to as ‘a’ and ‘b’ of a parabolic function that best fits the data and minimizes the error between the actual values and the values predicted by the model, adhering to the following equation:
Based on the quadratic regressions conducted for each defined period and using the CO₂e emissions data for Catalonia, the following values for ‘a’ and ‘b’ were obtained for each period:
| Period | a | b |
| 1990-2023 | -48,47 | 1.958,73 |
| 2014-2023 | -187,76 | 1.739,42 |
| 2019-2023 | -311,14 | 175,80 |
Once the quadratic regression models were calculated, validating the results before interpreting the values obtained was essential. This validation is crucial to ensure that the models fit the actual data appropriately and can be reliably used for predictions. In this case, two commonly used statistical indicators were applied: the coefficient of determination (R²) and the root mean square error (RMSE)9.
Thus, based on the ‘a’ and ‘b’ parameters obtained in each of the quadratic regressions for each period, and after calculating the coefficient of determination (R²) and the root mean square error (RMSE) for each, the results are as follows:
| Period | a (quadratic) | b (linear) | R² | RMSE |
| 1990-2023 | -48,47 | 1958,73 | 0,799 | 2776,6 |
| 2014-2023 | -187,76 | 1739,42 | 0,948 | 323,65 |
| 2019-2023 | -317,14 | 175,80 | 0,999 | 12,82 |


What do these results tell us?
Period 1990-2023
During this extended period, the coefficient a = −48.47 reflects a slight deceleration in the overall emissions trend. In contrast, the coefficient b = 1958.73 indicates significant initial growth, with notable annual increases during the early years. This shows that emissions grew at a steady pace at the beginning. Still, this growth gradually moderated, possibly due to factors such as the implementation of environmental measures and economic changes throughout the period.
Regarding model validation, the coefficient of determination R² = 0.799 indicates that the model explains 79.9% of the variability in actual emissions, representing a good overall fit. However, 20% of the variability remains unexplained, which is understandable given the length of the period, during which numerous external factors—such as the Kyoto Protocol, the Paris Agreement, economic crises, and technological advancements—have influenced emissions without being represented in the model. The RMSE value = 2776.60 kt CO₂e indicates a moderate average deviation between predictions and actual values. This result is acceptable, considering that the period encompasses very different phases: growth, stabilization, and decline.
Consequently, emissions do not follow a strictly quadratic trajectory, as complex variabilities and economic and environmental cycles influence reality. Nonetheless, as a first approach to identifying future trends, the model is appropriate and fulfills its function with reasonable accuracy.
Period 2014-2023
In this shorter and more recent period, the coefficient a = −187.76 reflects a much more pronounced deceleration than in the previous period, suggesting significant changes with a clear downward trend in emissions. The negative quadratic coefficient indicates this shift, while the coefficient b = 1739.42 shows that, although initial increases in emissions were moderate, they progressively diminished due to the quadratic component. This behavior demonstrates a clear trend toward reducing emissions, likely driven by stricter climate policies and technological advancements in production processes.
Regarding model validation, the coefficient of determination R² = 0.948 shows a significantly better fit than in the 1990–2023 period, explaining 94.8% of the variability in actual emissions. This indicates that the model’s trajectory aligns well with the data and is less influenced by external or random factors. Additionally, the RMSE value = 323.65 kt CO₂e, considerably lower than in the previous period, reinforces the model’s accuracy with clear and consistent trends during this timeframe.
Period 2019-2023
This latest period, the shortest of the three, shows the coefficient a = −311.14, the highest value among all the periods analyzed, indicating a substantial deceleration in CO₂e emissions. The coefficient b = 175.80, the lowest of all the periods, reveals that the initial linear growth in emissions is practically nonexistent. This highlights that the quadratic component of the model heavily influences the reduction in emissions.
In terms of validation, the coefficient of determination R² = 0.999 reflects an almost perfect fit, modeling nearly 100% of the variability in emissions during this period. This level of accuracy can be partly explained by the small number of data points and the fact that these follow a clear and consistent downward trajectory, which facilitates the model’s precision. As for the RMSE value = 12.82 kt CO₂e is the lowest among all the periods, confirming that the predictions are very close to the actual values. However, this apparent precision should be interpreted with caution: with so few data points, any structural change could significantly alter the future trends suggested by the model. Despite these limitations, the model suggests that emissions could continue to decline moderately in the coming years.
Final Conclusions
Once the data has been analyzed, the results strongly suggest that Catalonia is following a positive trajectory in reducing CO₂e emissions, with a notably accelerated decline in recent years. Both the long-term model (1990–2023) and the more recent ones (2014–2023 and 2019–2023) indicate that the current downward trend in CO₂e emissions could continue in the coming years, at least in the short term.
This behavior can be understood as the result of a combination of key factors: on the one hand, the implementation of stricter climate policies and, on the other, the impact of rising energy prices. These elements have encouraged, in recent years, a more efficient use of resources and promoted the integration of sustainable technologies across different economic sectors, particularly in many industrial production processes.
These results are consistent with other available data from various documentary sources, such as the value of energy intensity in Catalonia. Energy intensity is a parameter that, in the industry, measures how much energy is required to generate one euro of product. This data provides a clear view of the industry’s use of energy resources in relation to its productive activity. In Catalonia, if we calculate this parameter based on annual data from IDESCAT on the industrial sector’s GDP and its energy consumption, we find that, during the period 2003-2022, the energy intensity of Catalan industry has significantly decreased from 1.46 kWh/€ in 2003 to 0.78 kWh/€ in 2022. This result aligns with the analysis of EDGAR data, which has shown that, in recent years, annual CO₂e emissions in Catalonia have been steadily decreasing.
It seems clear, then, that the current pace of emissions reduction in Catalonia is positive. However, significant challenges remain to be addressed. Looking at electricity production statistics, we can see that, although a substantial reduction in electricity generation from natural gas was recorded between 2020 and 2023—mainly due to rising gas prices—in 2023, combined-cycle plants, cogeneration facilities, and nuclear power stations remained the main contributors to Catalonia’s energy mix, accounting for 73.65% of total energy production. In contrast, renewable energy sources such as hydropower, solar, wind, and biomass only contributed 15.36%. This imbalance highlights the need for further efforts to diversify energy sources and reduce dependence on fossil fuels. Increasing the use of renewable energy will be crucial to achieving a more sustainable energy model in the future.
As a result, maintaining the annual reduction rate of CO₂e emissions observed over the past three years will require implementing more ambitious actions to accelerate progress further and meet European commitments for 2030. In this context, adopting more ambitious energy transition policies in the coming years is essential. These policies should actively promote the use of renewable energy, encourage the electrification of transport, and continue enhancing energy efficiency in the industrial, residential, and service sectors.
The energy transition is an ongoing process that requires constant innovation and close collaboration among all social stakeholders. Cooperation between public administrations, businesses, and citizens will be fundamental to achieving the objectives of the European Green Deal and ensuring a sustainable future for present and future generations.
- EDGAR is a global, independent, and multifunctional database on anthropogenic greenhouse gas emissions and air pollution on Earth. EDGAR provides independent emission estimates compared to those reported by EU member states or parties under the United Nations Framework Convention on Climate Change (UNFCCC), using international statistics and a consistent IPCC methodology. While EDGAR is highly comprehensive, it focuses on gases with direct warming potential and globally consistent available data. Rare gases, complex organic compounds, and secondary emissions may not be included in detail or uniformly. https://edgar.jrc.ec.europa.eu ↩︎
- It is essential to highlight that the data from the EDGAR (Emissions Database for Global Atmospheric Research), widely used for global estimates, may not exactly match the official regional data provided by the Generalitat of Catalonia. The discrepancies between greenhouse gas (GHG) emission estimates provided by the EDGAR database and the official data from the Generalitat of Catalonia are primarily due to differences in calculation methodologies and the information sources used by both entities.
For example, in 2005, EDGAR estimated that Catalonia emitted 46,385 kt of CO₂ equivalent (CO₂e), while the Generalitat of Catalonia calculated 56,990 kt CO₂e.
EDGAR (Emissions Database for Global Atmospheric Research) produces global estimates based on statistical data on human activities, such as fossil fuel combustion, industrial processes, agriculture, and waste management. These data are complemented by standard emission factors and satellite information to improve the spatial distribution of emissions, but not for direct measurement.
https://edgar.jrc.ec.europa.eu/methodology
The Generalitat of Catalonia, through the Catalan Office for Climate Change (OCCC), follows the guidelines established by the Intergovernmental Panel on Climate Change (IPCC) and aligns with international standards such as ISO 14064-1. The Catalan methodology is based on the differentiation of emissions between:
Those regulated by the Emissions Trading System (ETS): sectors such as energy generation, large energy-intensive industrial installations (such as cement, paper, ceramics, and steel), and civil aviation.
Diffuse emissions (non-ETS): sectors such as transport, agriculture, buildings, and waste.
This methodology is detailed in the “Practical Guide for the Calculation of Greenhouse Gas (GHG) Emissions” and is complemented by tools like the “GHG Emissions Calculator.”
https://govern.cat/salapremsa/notes-premsa/507322/accio-climatica-actualitza-la-seva-calculadora-d-emissions-de-gasos-amb-efecte-d-hivernacle
https://govern.cat/salapremsa/notes-premsa/507322/accio-climatica-actualitza-la-seva-calculadora-d-emissions-de-gasos-amb-efecte-d-hivernacle
Despite the differences between the data from EDGAR and those from the Generalitat of Catalonia, using one source or another to analyze emission trends and evaluate the effectiveness of climate policies, as done in this article, does not compromise the validity of the calculations or conclusions. The most crucial aspect is consistently using a single data source over time. This ensures that, regardless of the absolute value provided by the chosen source, the annual evolution of emissions can be analyzed clearly and coherently. This approach allows for determining whether a territory is effectively reducing its emissions without methodological differences in data collection or calculation, qualitatively altering the conclusions of the analysis. ↩︎ - F-gases, or fluorinated gases, are a group of greenhouse gases that include hydrofluorocarbons (HFCs), perfluorocarbons (PFCs), sulfur hexafluoride (SF₆), and nitrogen trifluoride (NF₃). ↩︎
- CO₂ Equivalent (CO₂e) – CO₂e, or carbon dioxide equivalent, is a measurement unit used to compare emissions of different greenhouse gases based on their Global Warming Potential (GWP). This unit expresses the climate impact of various gases in terms of the effect that the same amount of carbon dioxide (CO₂) would have in the atmosphere. CO₂e facilitates the comparison and quantification of emissions from gases with different warming potentials, such as methane (CH₄), nitrous oxide (N₂O), or fluorinated gases, as each has a distinct capacity to trap heat in the atmosphere. For example, methane has a GWP of 28, meaning that one ton of methane emitted into the atmosphere is equivalent to 28 tons of CO₂e. Similarly, nitrous oxide has a GWP of 268, meaning one ton of nitrous oxide emitted into the atmosphere is equivalent to 268 tons of CO₂e. This method allows emissions from different gases to be aggregated and compared easily. ↩︎
- According to statistical data from Red Eléctrica https://www.ree.es/en/datos/generacion/estructura-generacion and the Catalan Institute of Energy (ICAEN) https://icaen.gencat.cat/ca/energia/estadistiques/resultats/anuals/balanc_energia/. ↩︎
- A critical note about data processing: For an accurate analysis, I decided to exclude data for 2020. That year, marked by the COVID-19 pandemic, showed an anomalous drop in emissions. Including this outlier could significantly bias the results and affect future trend forecasting. ↩︎
- Brown’s exponential smoothing has also been considered an alternative to quadratic regression, as this method is particularly suitable for non-stationary data with trends, such as CO₂e emissions. Furthermore, the Brown model would allow for the detection of potential short- and medium-term trends more dynamically, as it better adjusts to recent changes in the data. However, the model evaluation metrics have confirmed that quadratic regression accurately represents the overall behavior of the available data. Therefore, for the purposes of this article, quadratic regression has been deemed the most appropriate initial technique. ↩︎
- It is important to highlight that this quadratic regression prediction model has significant limitations. It does not include exhaustive research or multivariable analysis that would establish causal relationships between economic, industrial, and legislative factors and the detected trends. Implementing a more complex model would be appropriate for a more comprehensive study addressing the complexity of factors influencing CO₂ emissions. ↩︎
- R² and RMSE are two widely used statistical tools to assess a mathematical model’s quality. R² (the coefficient of determination) indicates how much of the variability in real-world data is explained by the model. A value close to 1 means the model describes the data well, while a value close to 0 suggests little relationship between the model and the actual data. Conversely, RMSE (Root Mean Square Error) measures, on average, the model’s error in its predictions. Expressed in the same units as the data, RMSE shows how far the model’s predictions deviate from actual values. In other words, R² helps us understand “how well the model explains real data,” while RMSE indicates “how precise its predictions are.” To ensure that the models align with reality and can credibly predict CO₂e emission trends in the coming years, achieving a high R² and a low RMSE is essential. ↩︎